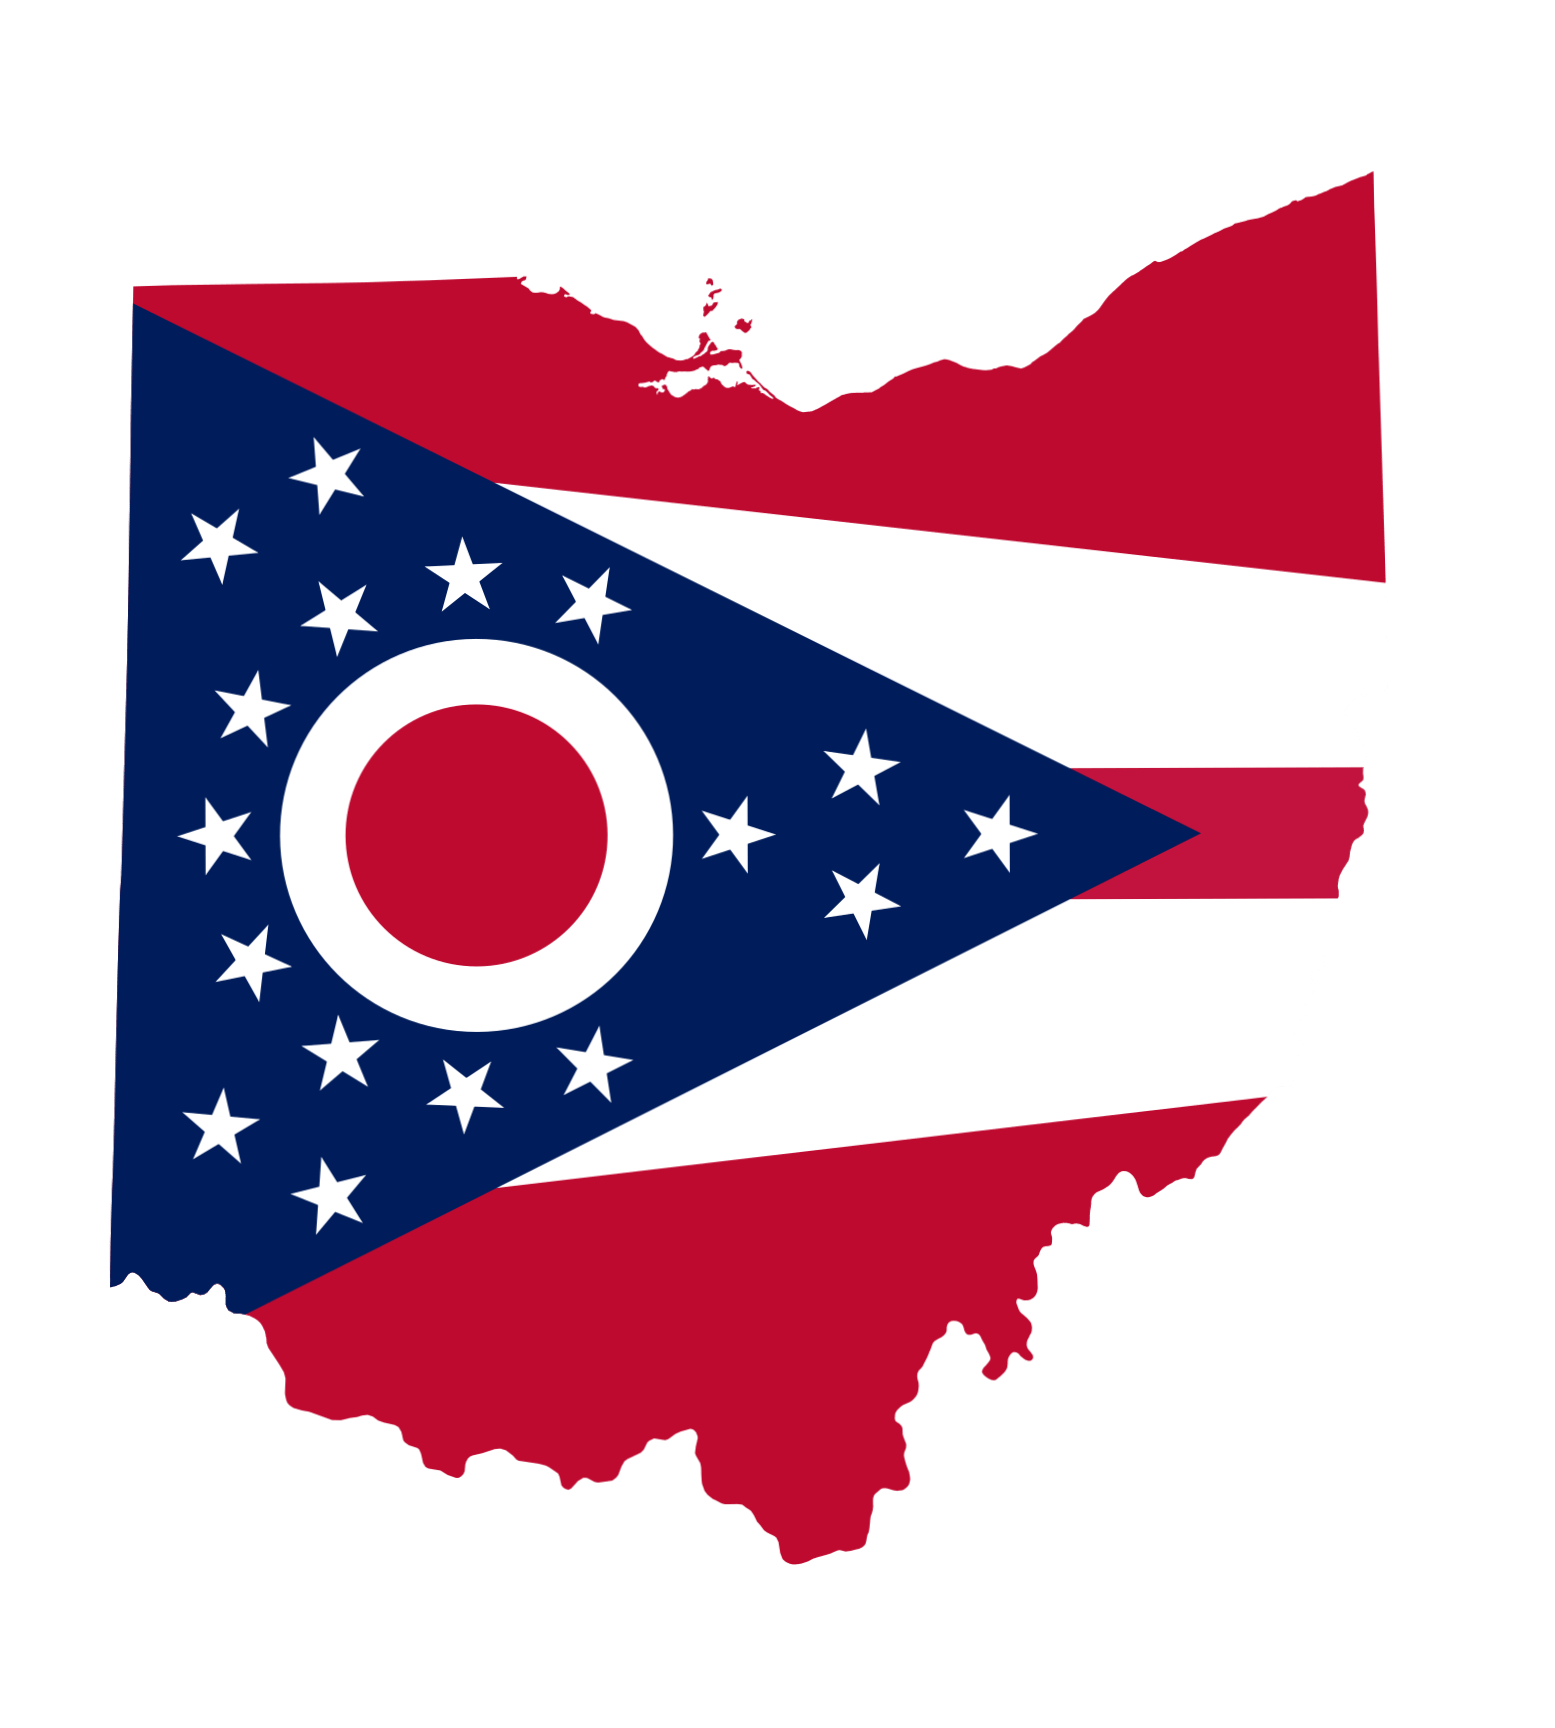
This market will resolve according to the winner of the 2026 Ohio U.S. Senate special election currently scheduled for November 3, inclusive of any run-offs.
A candidate shall be considered to represent a party in the event that he or she is the nominee of the party in question. Candidates other than the Democratic or Republican nominee (e.g., Greens, Libertarian, independent) may be added at a later date.
Candidates who run as independents will not be encompassed by the “Democrat” or “Republican” options regardless of any affiliation they may have with the party.
The resolution source for this market is the Associated Press, Fox News, and NBC. This market will resolve once all three sources call the race for the same candidate. If all three sources haven’t called the race in this state for the same candidate, this market will resolve based on the official certification.
Jon Husted (R)
$44.6K Volume
52%
Sherrod Brown (D)
$61.9K Volume
50%
Odds & FAQ
What are the current odds for Ohio Senate Election Winner?
It's a genuine race: Jon Husted (R) edges the field at 52%, barely ahead of Sherrod Brown (D) at 49%. Tight markets like this can flip on one headline.
What do traders predict for Ohio Senate Election Winner?
Traders give Jon Husted (R) a 52% chance - essentially a toss-up. In markets this tight, the implied odds can swing on a single piece of news.
When does the Ohio Senate Election Winner market resolve?
Mark 3 Nov 2026 (102 days left): that's when this market is due to resolve, following Polymarket's published criteria once the result is verified.
How much money is trading on Ohio Senate Election Winner?
$106.5K in total volume has traded here. Deeper markets like this tend to price events more sharply.
How can I trade Ohio Senate Election Winner on Polymarket?
Follow this page for live prices; trading happens on Polymarket itself. Start small - implied odds move, and so can your position's value.
Similar Markets
Democratic Party95%YesNo
Republican Party5%YesNo
Republican Party93%YesNo
Democratic Party7%YesNo
Republican Party94%YesNo
Democratic Party7%YesNo
Republican Party94%YesNo
Democratic Party6%YesNo
Republican Party82%YesNo
Democratic Party18%YesNo
 Republican58%YesNo
 Democrat43%YesNo
Republican Party69%YesNo
Democratic Party29%YesNo
Republican Party60%YesNo
Democratic Party43%YesNo